Difference between revisions of "M8 PSHA Analysis"
| Line 33: | Line 33: | ||
== M8 Rupture Images == | == M8 Rupture Images == | ||
| − | *[[]] | + | *[[CyberShake Data Web Service - SRF Retrieval]] |
Revision as of 20:17, 7 October 2010
The M8 PSHA analysis compares estimated ground motions for M8 using standard empirical attenuation relationship methods versus full wave propagation results. The UCERF2 also provide probabilities for this event using current best estimates.
UCERF2 M8 Rupture Match:
The UCERF 2.0 rupture from CyberShake that matches M8 was found using the following guidelines:
- Use SCEC-VDO SRF Plugin to access a list of UCERF2.0 ruptures with 1 year probabilities.
- Select CyberShake Ruptures ID:35 (Rupture Set 34 has been deprecated)
- Select Source that includes the San Andreas Segments included in the M8 fault. We have selected Source ID 89 as the source that includes San Andreas Segments PK,CH,CC, BB, NM,SM,NSB,SSB,BG, and C0.
- Select Rupture Variation Scenario ID: 3. Scenario ID 4 is new as of the SCEC Annual meeting 2010 and has not been used in any CyberShake calculations.
- Select a Rupture ID with Magnitude similar to M8. We select Rupture ID 3 with M8.05 and Probability: 2.0546511e-5
- Select a rupture variation with a hypocenter location near the M8 hypocenter (-120.396396, 35.846868, -16,000).
- Selected event is 89_3 variation S0055-H0026 with Hypocenter at (-120.3858, 35.849, -15.5655) as closest matching UCERF rupture.
- Given event has a one year probability as 0.000020546511 or annual occurrence probability of 1 in 48,670.066
M8 PSHA Peak Ground Motion Map
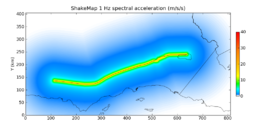
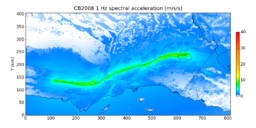
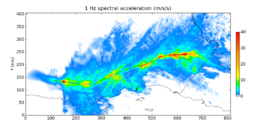
Ground motion estimates for the M8 rupture can be produced using empirically derived attenuation relationship (i.e. ShakeMap AR and Campbell and Bozorgnia 2008) or using full 3d wave propagation simulations such as M8. The wave propagation approach is more computationally expensive however this approach is expected to produce more accurate ground motion estimates. The following maps are intended to compare the results using these different approaches including alternative attenuation relationships. SCEC's OpenSHA software was used to create the attenuation-relationship maps. The M8 map is produced from M8 wave propagation simulation results.
M8 CyberShake Peak Ground Motion Map
A further technique is to update the ground motion map using full 3d waveform from the CyberShake simulation for this event.


