Uploads by Maechlin
From SCECpedia
Jump to navigationJump to searchThis special page shows all uploaded files.
| Date | Name | Thumbnail | Size | Description | Versions |
|---|---|---|---|---|---|
| 05:40, 28 August 2011 | Scecpedia qr.png (file) |  |
387 bytes | 1 | |
| 01:38, 8 September 2011 | Swiss Seismological Service-Logo.png (file) | 637 bytes | 1 | ||
| 17:00, 1 October 2015 | PhilipMaechling ORCID.png (file) |  |
844 bytes | 1 | |
| 17:29, 26 February 2020 | Sorted Storage Jan2020.txt (file) | 2 KB | 1 | ||
| 04:30, 16 August 2018 | Vertical profile.kml (file) | 2 KB | 2 | ||
| 17:29, 26 February 2020 | Disk Usage Jan2020.txt (file) | 4 KB | 1 | ||
| 19:50, 13 August 2013 | Cc3 88x31.png (file) |  |
5 KB | 1 | |
| 19:11, 22 September 2010 | TconfintETAScum2004.png (file) |  |
6 KB | 1 | |
| 19:11, 22 September 2010 | TconfintTripleScum2004.png (file) |  |
6 KB | 1 | |
| 19:11, 22 September 2010 | TconfintSTEPcum2004.png (file) |  |
7 KB | 1 | |
| 15:01, 7 September 2010 | SCEC NSF-USGS-words logo.png (file) | 11 KB | SCEC Logo | 1 | |
| 08:27, 10 September 2010 | SCEC NSF-USGS-words logom.png (file) |  |
11 KB | 1 | |
| 01:27, 8 September 2011 | Sed eth logo.png (file) | 12 KB | 1 | ||
| 21:21, 26 September 2018 | Depth.pdf (file) | 12 KB | 1 | ||
| 03:55, 25 February 2011 | Slide1.PNG (file) |  |
14 KB | 1 | |
| 03:56, 25 February 2011 | CVM H vx interface.PNG (file) |  |
14 KB | 1 | |
| 03:56, 25 February 2011 | CVM H vx lite interface.PNG (file) |  |
17 KB | 1 | |
| 23:11, 27 October 2023 | SummitPlusFig1.jpg (file) |  |
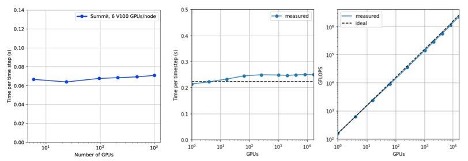
19 KB | Figure 1. Weak and strong scaling tests on Summit for different versions of AWP-ODC. AWP-ODC with support for topography achieves 94% weak scaling efficiency. | 1 |
| 22:05, 17 October 2010 | GroundMotionEvaluation.png (file) |  |
19 KB | 1 | |
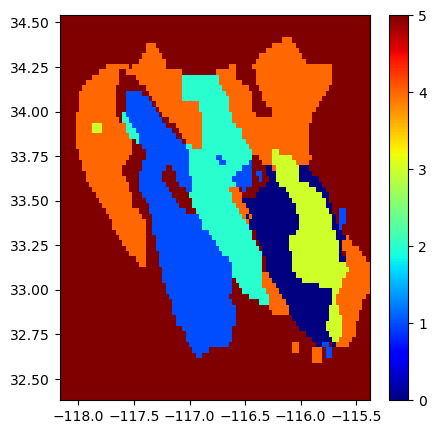
| 19:38, 31 August 2022 | Velocity clusters.png (file) |  |
23 KB | 1 | |
| 23:00, 28 May 2018 | Cvmh vp versus density 1000km.png (file) |  |
23 KB | 1 | |
| 17:25, 29 June 2018 | Wills 2006.png (file) |  |
24 KB | 1 | |
| 00:42, 17 May 2018 | Vp vs density cs173.png (file) |  |
25 KB | 1 | |
| 18:36, 17 May 2018 | Vp density 10000.png (file) |  |
29 KB | 1 | |
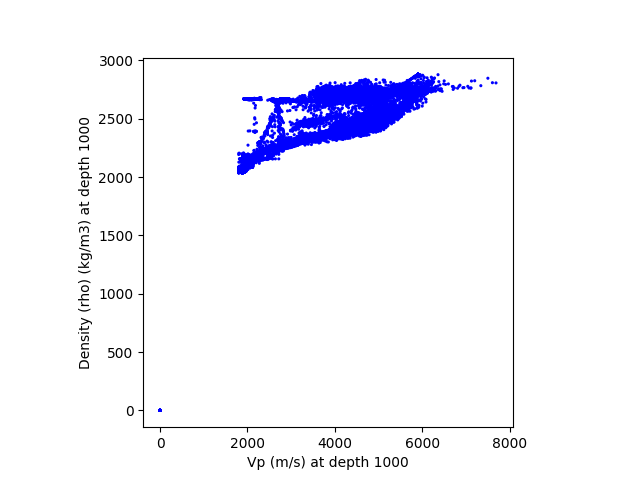
| 18:35, 17 May 2018 | Vp density 1000.png (file) |  |
29 KB | 2 | |
| 18:29, 17 May 2018 | Vp density 40000.png (file) |  |
29 KB | 1 | |
| 20:42, 2 October 2010 | Nsf1.jpg (file) |  |
30 KB | NSF Logo retrieved 1 October 2010 | 1 |
| 18:18, 24 May 2018 | Cca rho versus density 1000km.png (file) |  |
31 KB | 1 | |
| 16:11, 24 January 2014 | Plot CVM-S Vs avg.png (file) |  |
31 KB | 1 | |
| 18:18, 24 May 2018 | Cencal rho versus density 1000km.png (file) |  |
32 KB | 1 | |
| 21:06, 27 May 2018 | Cca rho versus vp density 1000km.png (file) |  |
32 KB | 1 | |
| 16:18, 24 January 2014 | Plot CVM-H 11.9.1 with GTL Vs avg.png (file) |  |
32 KB | 1 | |
| 21:06, 27 May 2018 | Cencal rho versus vp density 1000km.png (file) |  |
32 KB | 1 | |
| 18:19, 24 May 2018 | Cvms5 rho versus density 1000km.png (file) |  |
32 KB | 1 | |
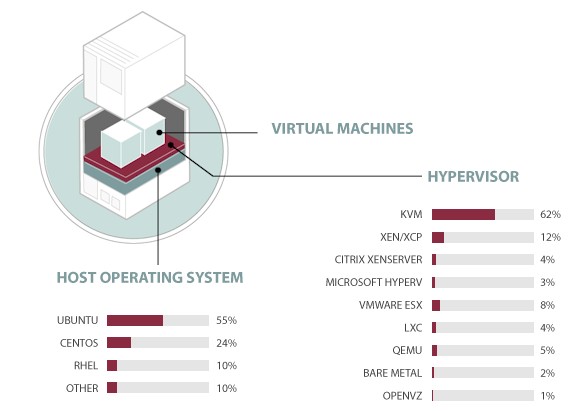
| 18:52, 11 November 2013 | Openstack-hypervisor-os.jpg (file) |  |
32 KB | 1 | |
| 22:18, 27 May 2018 | Cvmh rho versus vs density 1000km.png (file) |  |
33 KB | 1 | |
| 21:06, 27 May 2018 | Cvms5 rho versus vp density 1000km.png (file) |  |
33 KB | 1 | |
| 21:19, 27 May 2018 | Cvmh rho versus vp density 1000km.png (file) |  |
34 KB | 1 | |
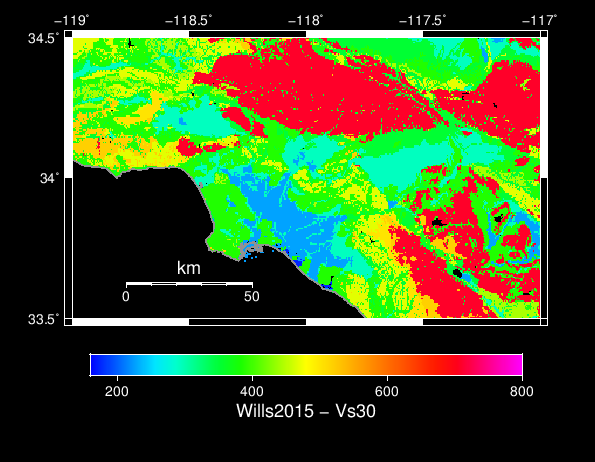
| 17:25, 29 June 2018 | Wills 2015.png (file) |  |
34 KB | 1 | |
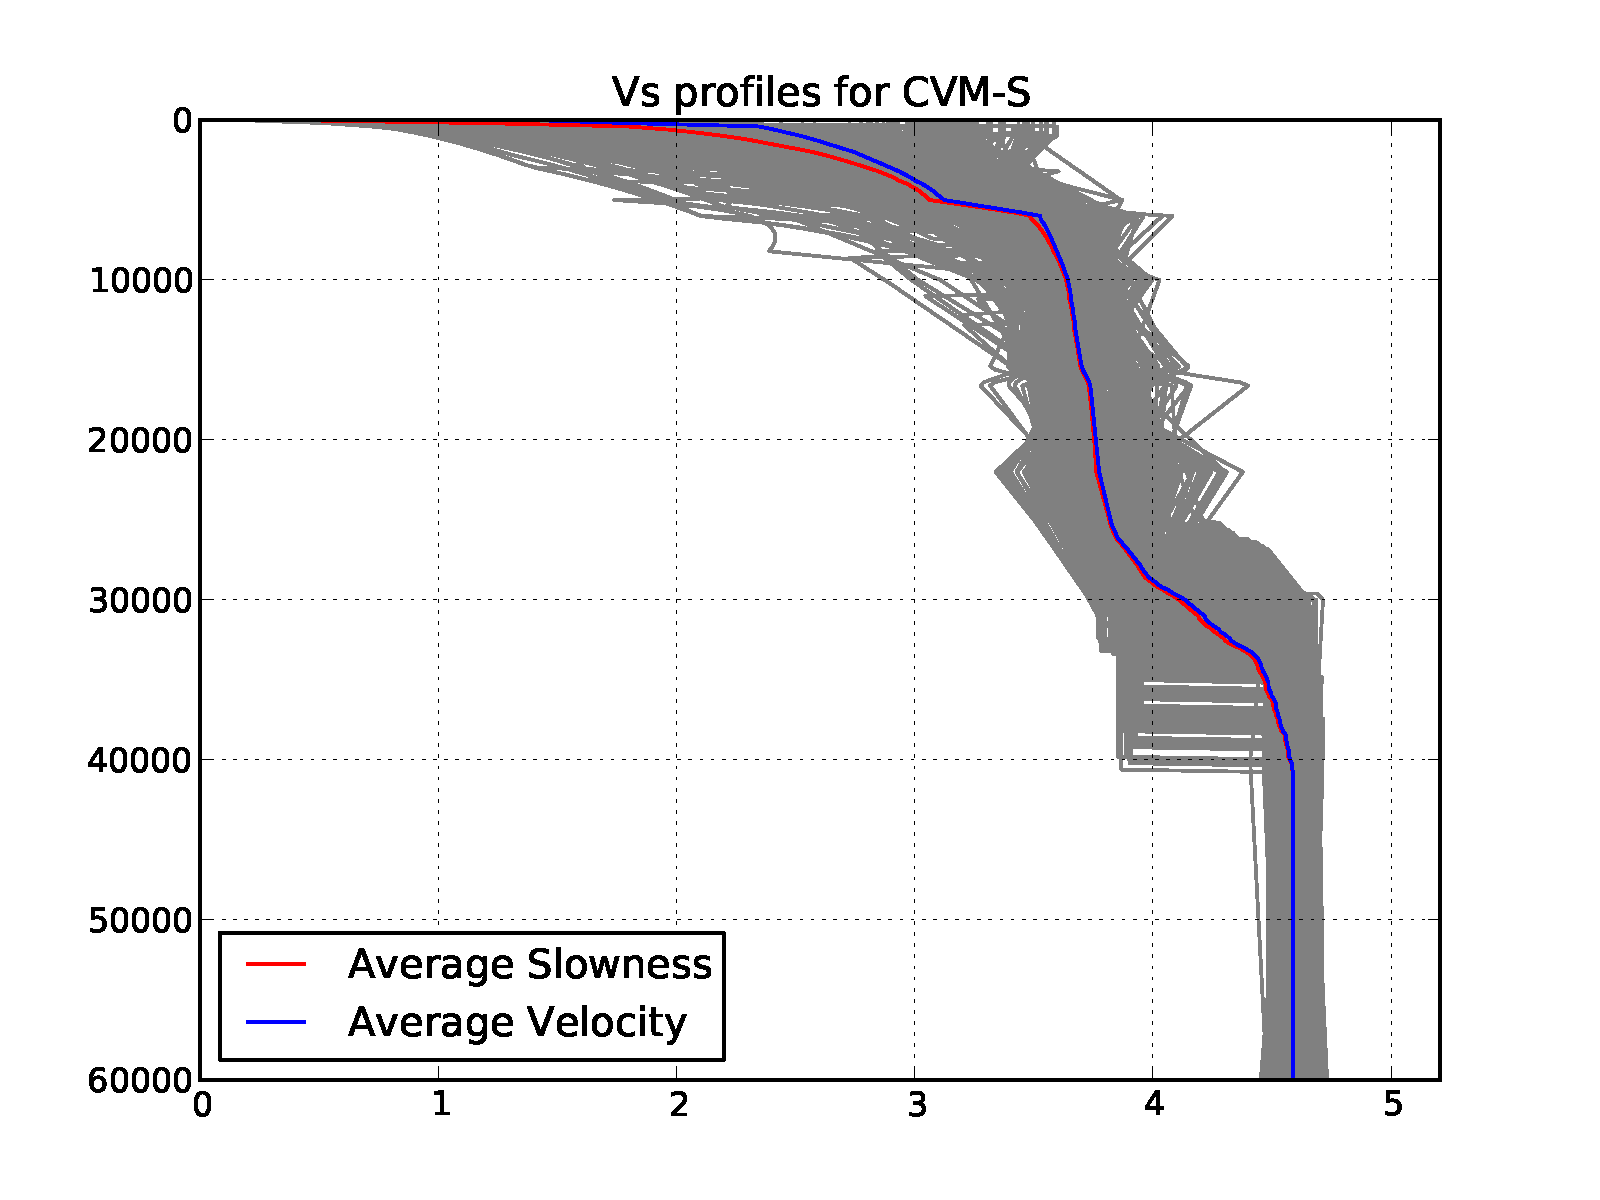
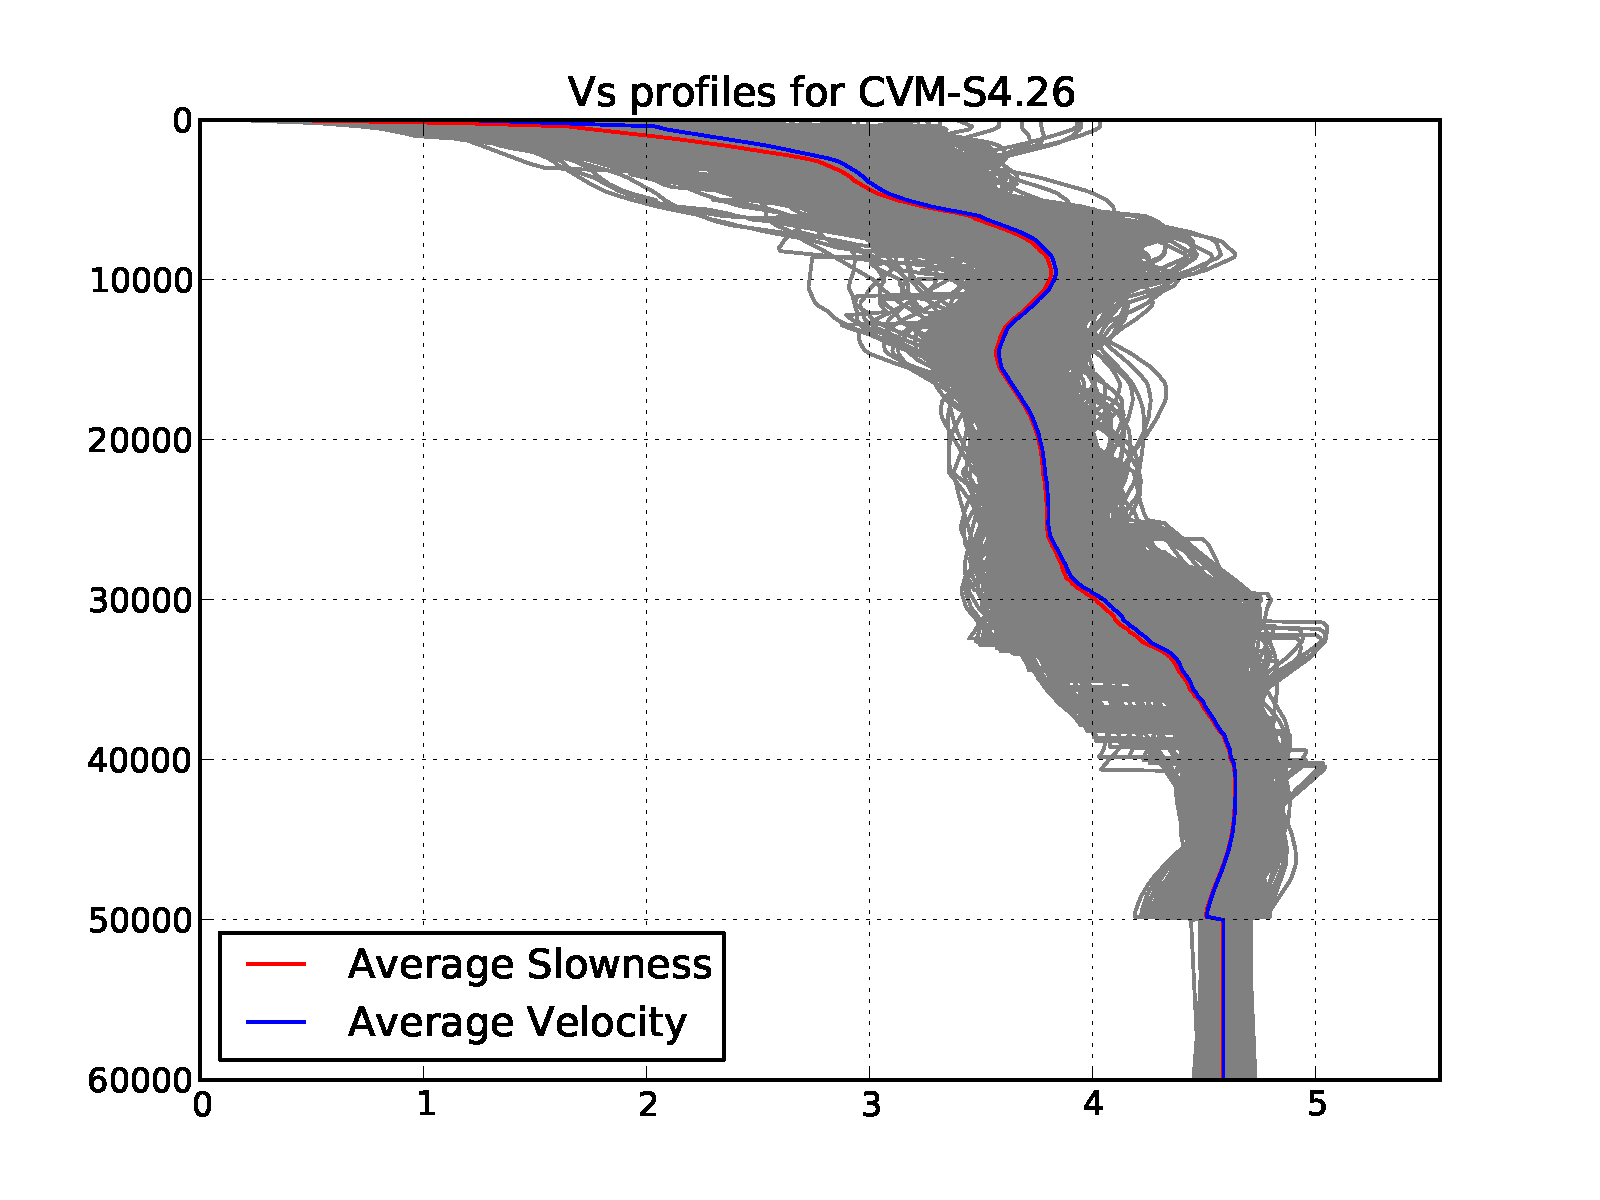
| 16:17, 24 January 2014 | Plot CVM-S4.26 Vs avg.png (file) |  |
36 KB | 1 | |
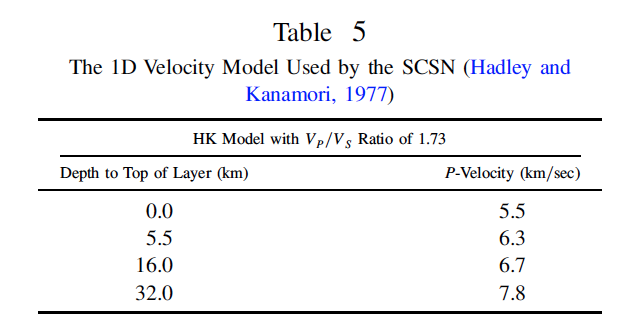
| 02:14, 16 January 2014 | HadleyKanamori-1D.png (file) |  |
36 KB | 1 | |
| 21:32, 17 October 2010 | CaliforniaNatLab.png (file) |  |
39 KB | 1 | |
| 22:27, 17 October 2010 | CISN EQ Example.jpg (file) |  |
39 KB | 1 | |
| 20:38, 7 October 2010 | Simulation Frequencies.png (file) |  |
39 KB | 1 | |
| 23:15, 27 October 2023 | SummitPlusFig1.pdf (file) | 41 KB | Figure 1. Weak and strong scaling tests on Summit for different versions of AWP-ODC. AWP-ODC with support for topography achieves 94% weak scaling efficiency. | 1 | |
| 22:33, 26 February 2020 | Csep gitlab roadmap.pdf (file) |  |
42 KB | 1 | |
| 00:08, 12 October 2010 | Define Reference Events.png (file) |  |
42 KB | 1 | |
| 21:24, 26 September 2018 | Query by depth.png (file) | 42 KB | 1 | ||
| 22:50, 1 November 2018 | 1d 60k depth.png (file) |  |
43 KB | 1 | |
| 22:31, 26 February 2020 | Csep gitlab roadmap.pptx (file) | 43 KB | 1 |