Difference between revisions of "Lin Thurber CVM"
From SCECpedia
Jump to navigationJump to search| Line 1: | Line 1: | ||
| − | CME is implementing a programmatic version of the Lin Thurber 3D state-wide CVM. | + | CME is implementing a programmatic version of the Lin Thurber 3D state-wide CVM. Here is info on the first of four of our regional-scale 3D P-wave velocity models that I will provide. This is for our Northern California model, published in |
| + | |||
| + | [http://hypocenter.usc.edu/research/UCVM/BSSA_2010_Lin_3Dvel_state.pdf Thurber, C., H. Zhang, T. Brocher, and V. Langenheim, Regional three-dimensional seismic velocity model of the crust and uppermost mantle of northern California, J.Geophys. Res., 114, B01304, doi:10.1029/2008JB005766, 2009] | ||
| + | |||
| + | #Formally, the bounding rectangle is approximately given below however, the western edge realistically is the California coastline, and the northern edge is not quite to the Oregon border. | ||
| + | *42.60, -122.32 | ||
| + | *40.34, -126.27 | ||
| + | *37.74, -117.88 | ||
| + | *35.62, -121.71 | ||
| + | #The bottom nodes of the model are at 36 km. | ||
| + | #Node spacing is mostly 10 or 15 km in the NE-SW direction and is uniformly 20 km in the NW-SE direction. Actual model resolution based on checkerboard tests is nominally ~twice the node spacing. | ||
| + | #Just Vp. | ||
== Example Views of Lin Thurber CVM == | == Example Views of Lin Thurber CVM == | ||
Revision as of 04:18, 6 April 2011
CME is implementing a programmatic version of the Lin Thurber 3D state-wide CVM. Here is info on the first of four of our regional-scale 3D P-wave velocity models that I will provide. This is for our Northern California model, published in
- Formally, the bounding rectangle is approximately given below however, the western edge realistically is the California coastline, and the northern edge is not quite to the Oregon border.
- 42.60, -122.32
- 40.34, -126.27
- 37.74, -117.88
- 35.62, -121.71
- The bottom nodes of the model are at 36 km.
- Node spacing is mostly 10 or 15 km in the NE-SW direction and is uniformly 20 km in the NW-SE direction. Actual model resolution based on checkerboard tests is nominally ~twice the node spacing.
- Just Vp.
Example Views of Lin Thurber CVM
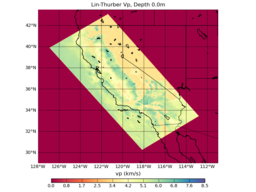
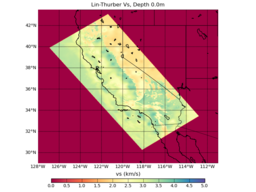
These preliminary maps are based on querying the model at an elevation offset of -1000.0m from MSL. We will need to add a DEM to UCVM in order to properly query this model by depth. The model is referenced using inverse bilinear interpolation of the original model boundaries.
As seen in the plots, the Vp model is higher resolution (10km) than the Vs Model (30km).

