Difference between revisions of "CVM Evaluation"
| Line 43: | Line 43: | ||
== Related Entries == | == Related Entries == | ||
| − | |||
| − | |||
*[[Goodness of Fit]] | *[[Goodness of Fit]] | ||
*[[CVM-S]] | *[[CVM-S]] | ||
| + | *[[CVM-H]] | ||
*[[CVM-H v6.3capi]] | *[[CVM-H v6.3capi]] | ||
*[[CVM Toolkit]] | *[[CVM Toolkit]] | ||
| − | |||
*[[Community Velocity Model]] | *[[Community Velocity Model]] | ||
*[[UCVM]] | *[[UCVM]] | ||
Revision as of 03:55, 24 February 2011
SCEC's CVM evaluation system is designed to show differences between currently available California CVM's. Our CVM evaluations use wave propagation simulations of moderate magnitude historical earthquakes and goodness-of-fit measurements that compare simulation waveforms (or amplitudes) to observational data.
CVM evaluations involves the following:
- CVM evaluations are run prior to release of new version of CVM-H, or other SCEC CVM's. Multiple CVM's are evaluated at one time, so that performance of a new CVM can be compared to existing, or prior, CVM versions.
- A software distribution each CVM is posted online so that it is accessible to the SCEC Community
- Each CVM is used to construct a velocity mesh for a 1Hz Chino Hills simulation. In the future, additional validation events may be used.
- The system runs a 1Hz wave propagation simulation and compares simulation results to observed seismograms for the event
- CVM Evaluation results, including velocity profiles, and waveform-based goodness of fit measures, are posted online for review.
Contents
Recent CVM Evaluations
CVM evaluations are typically run when new CVM's are released. In Feb, 2011, we released CVM-H v11.2, at which time, we ran CVM evaluations for three different SCEC CVM's including:
Evaluation results for CVM-H v11.2 and other SCEC CVM's are posted here:
Goodness of Fit Measures
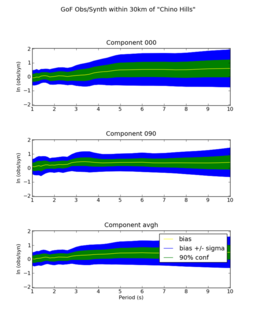
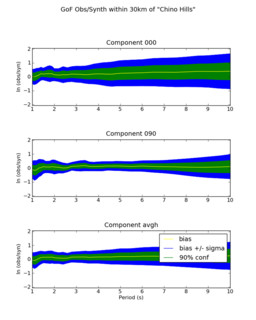
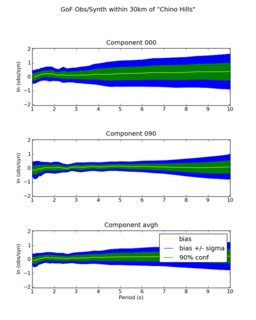
Our CVM Evaluation system uses several goodness of fit measures including bias plots comparing peak amplitudes of synthetic seismograms to amplitudes of observed seismograms across wave frequencies for seismic wave frequencies at 2 seconds periods and longer.
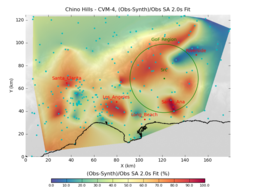
Map-based Goodness of Fit
This images shows a map-based goodness of fit metric. It compares spectral acceleration from our synthetic seismograms to the observed ground motions for the Chino Hills event. The map uses a 0-100 scale with 100 a perfect fit of synthetics to observations.


