UCVM Vs30
Contents
UCVM Vs30 Method
Vs30 at recording stations
- For interpretation of recorded data, use in order of preference
- values listed as "Vs30 (m/s) selected for analysis" in the NGA-West2 database flatfile
- if stations are not included in the NGA-West2 database, we will use the values from Will et al. 2015 as retrieved from UCVM (with interpolation)
- For interpretation of simulation data
- We retrieved the Vs30 values using UCVM v19.4 for CVM-S4.26.M01 (cvmsi), for CVM-S4.26 (to show impact of adding .M01 GTL), for CVM-S4 (to check if Vs30 matches .M01 exactly), and from the Wills 2015 Vs30 model embedded in UCVM.
- For the Vs30_query against the models uses a slowness algorithm, and a 1 meter spacing.
- The Wills 2015 Vs30 values are based a processing sequence that includes converting a GIS shape file into a rasterized Vs30 grid of values produced by Kevin Milner. Kevin provided a file raster_0.00025.flt, which is rasterized with 0.00025 degree spacing (~25 meters). This file is then used to generate an etree which is used to stored the rasterized data. When query points are given between grid points, then ucvm implements interplolation of Vs30 values between associated grid points. More
- More details on the Willis Map integration here: Wills Map.
- Descriptions of UCVM Vs30 Slowness algorithm here: UCVM_Vs30.
- Description of CyberShake Vs30 Slowness algorithm here: CyberShake_Code_Base#Stochastic codes
| Lon | Lat | Vs30 - Wills 2015 (UCVM v19.4) | Vs30 - Slowness Method (1m spacing) (CVM-S4.26.M01 - cvmsi) | Vs30 - Slowness Method (CVM-S4.26 - cvms5) | Vs30 - Slowness Method (CVM-S4 - cvms) | Vs30 - Slowness Method (CVM-H - cvmh) |
| -117.9568 | 33.8401 | 293.500 | 284.461 [1] | 838.630 | 284.461 | 120.690 |
| -117.8179 | 33.8533 | 351.900 | 329.762 [2] | 850.496 | 329.762 | 394.852 |
| -117.8869 | 33.8891 | 312.445 | 344.043 [3] | 861.493 | 344.043 | 345.057 |
| -117.9590 | 33.8663 | 228.200 | 287.845 [4] | 839.552 | 287.845 | 120.690 |
| -117.9311 | 33.9085 | 386.600 | 349.812 [5] | 901.162 | 349.812 | 551.916 |
| -117.9558 | 33.9315 | 386.600 | 349.317 [6] | 889.947 | 349.317 | 705.182 |
| -117.8033 | 33.9273 | 385.100 | 367.423 [7] | 907.358 | 367.423 | 360.902 |
| -117.8571 | 33.8530 | 228.200 | 329.762 [8] | 847.254 | 329.762 | 281.789 |
| -118.0469 | 33.8892 | 228.200 | 287.845 [9] | 838.561 | 287.845 | 285.982 |
| -118.0575 | 33.9282 | 386.600 | 354.637 [10] | 855.127 | 354.637 | 224.184 |
| -117.8656 | 34.0210 | 419.818 | 370.670 [11] | 955.197 | 370.670 | 426.076 |
| -117.9812 | 33.8077 | 228.200 | 285.871 [12] | 839.554 | 285.871 | 237.354 |
| -117.9224 | 33.8717 | 293.500 | 362.574 [13] | 845.207 | 362.574 | 262.028 |
| -117.9237 | 33.9454 | 385.411 | 331.459 [14] | 932.222 | 331.459 | 726.045 |
| -117.9508 | 34.0095 | 293.500 | 309.646 [15] | 937.482 | 309.646 | 1062.044 |
We are reviewing the algorithms used to calculate Vs30 in UCVM.
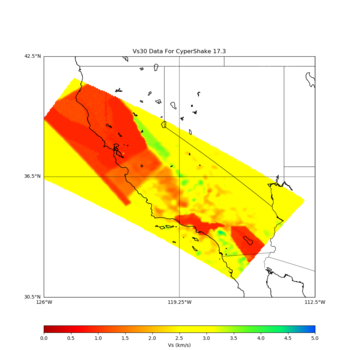
UCVM CS173 Model-based Vs30
Vs30 based on tiled models queried at 1m spacing 0-29m depth using slowness calculation
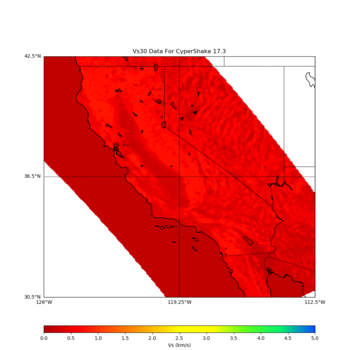
UCVM Etree Vs30 Map
Vs30 from UCVM etree map, based on Willis 2006 map and Wald Topography (outside California)
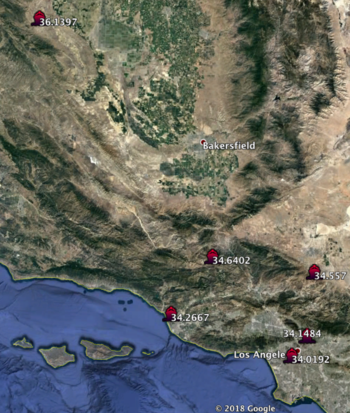
Vs30 Test Points shown On Map
Vs30 from UCVM etree map, based on Willis 2006 map and Wald Topography (outside California)
Introduction
There may be an issue with how UCVM calculates Vs30 values. Presently UCVM uses the following formula:
- 31/ sum(Vs sampled from [0,30] at 1 meters, for 31 total values)
Rob has suggested that the correct formula should be:
- 30 / sum(1 / (Vs sampled from [0, 30) at 1 meters, for 30 total values))
This can have a significant impact for Vs30 calculations. For the BBP1D model, UCVM calculates the Vs30 as 932m/s, whereas Rob's formula calculates it as 862m/s.
Another approach was used in CyberShake Study 15.12, in conversations with Rob:
- Vs30 = 30 / Sum (1/(Vs sampled from [0.5,29.5] in 1 meter increments, for 30 total values)).
Points for comparison
We have selected 6 points to compare Vs30 as generated using the CyberShake approach (using half-meters) to other UCVM approaches.
- Input points for ucvm_query:
 34.1484  -118.1712
 34.5570 -118.1250
 34.0192 -118.2860
 34.6402 -118.9192
 36.1397 -120.3602
 34.2667 -119.2285
| lat | lon | Velocity model | CyberShake-generated Vs30 | UCVM 18.5 Gen Vs30 | UCVM 18.5 (Wills 2015) | UCVM Vs30 etree.map (Wills 2006) | UCVM Vs30 etree.map (Wills 2015) |
|---|---|---|---|---|---|---|---|
| 34.148426 | -118.17119 | CVM-S4.26.M01 | 838.8 | 821.328 | 821.335 | 748.00 | 710.1 (cvmsi) |
| 34.557 | -118.125 | CVM-S4.26.M01 | 2573.6 | 2573.634 | 324.974 | 497.68 | 402.1 (cca) |
| 34.0192 | -118.286 | CVM-S4.26.M01 | 313.1 | 310.574 | 310.574 | 280.0 | 293.5 (cvmsi) |
| 34.64021 | -118.91919 | CCA-06 | 3393.9 | 3331.251 | 561.377 | 748.0 | 710.1 (cca) |
| 36.13968 | -120.36015 | CCA-06 | 2277.2 | 2279.326 | 261.704 | 349.0 | 293.5 (cca) |
| 34.26667 | -119.22848 | CCA-06 | 902.3 | 902.013 | 244.135 | 280.0 | 325.5 (cca) |
Querying cs173 slow due to the fine resolution
To run on max memory on hpc cluster nodes
#!/bin/bash
#SBATCH -p scec
#SBATCH --ntasks=1 #number of tasks with one per processor
#SBATCH -N 1 # number of nodes
#SBATCH --mem 0 # Set to unlimited memory
#SBATCH --time=12:00:00
#SBATCH -o ucvm2mesh_mpi_%A.out
#SBATCH -e ucvm2mesh_mpi_%A.err
#SBATCH --export=NONE
#SBATCH --mail-user=maechlin@usc.edu
#SBATCH --mail-type=END

cd /auto/scec-00/maechlin/ucvmc185/utilities
srun -v --mpi=pmi2 /auto/scec-00/maechlin/ucvmc185/utilities/plot_vs30_map.py -b 30.5,-126.0 -u 42.5,-112.5 -s 0.01 -a s -c cs173 -o vs30_cs173.png
-bash-4.2$
Related Links:
Plot command used to plot_vs30_map. ./plot_vs30_map.py -b 30.5,-126.0 -u 42.5,-112.5 -s 0.05 -a s -c cs173 -o vs30_cs173.png
Scott posted vs30 values from CyberShake here: http://scec.usc.edu/scecpedia/CyberShake_Study_15.12#Vs_values_v2.0
Notes on Software Implementation for Review
     UCVM/src/ucvm/ucvm_map.c
     -- etree from Walls data
        is used to calculate interpolated vs30 values
          4 surrounding points -- interploate_bilinear

     UCVM/src/vs30/vs30_query.c
     -- vs30 calculated as 'slowness'
        vs= 31/vs_sum  (vs_sum => sum of(1/query_data.cmb.vs)
                        where z from 0 to 30)

     cvmh1511/src/vs30_gtl.c
     -- vs30 derived GTL base on Ely (2010)
        gtl model file is loaded into model
        location is 'rounded' in retrieving
        -> These gtl file are generated from Wills
             cvm_vs30_wills.hdr
             cvm_vs30_wills.mdl

     cvms5/src/cvms5.c, cca/src/cca.c
     -- cvms5_get_vs30_based_gtl()
           calls
           cvms5_get_vs30_value()
              -- get 4 surrounding points from etree(payload 0,1,2,3)
                 and bilinear interpolation?
suspicous selection:
   vs30_payload[0].vs30 = percent * vs30_payload[0].vs30 + (1 - percent) * vs30_payload[1].vs30;
   vs30_payload[1].vs30 = percent * vs30_payload[2].vs30 + (1 - percent) * vs30_payload[3].vs30;
        return vs30_payload[0].vs30;

     cvms -- no vs30
     cencal -- no vs30

     cvms426/src/vs30_gtl.c
     -- >>vs30_gtl.c - Vs30 derived GTL based on Ely (2010)
        >>06/2013: DJG - taken from CVM-H and adapted to CVM-S4.23
        >>sprintf(gtldir, "%s/cvm_vs30_wills", modelpath);
        >>if (ADD_GTL) {
        >>   gtl_setup(gtldir);
  gcoor[0]=round((entry->coor_utm[0]-gtl.extent[0])/gtl.spacing);
  gcoor[1]=round((entry->coor_utm[1]-gtl.extent[2])/gtl.spacing);
     location is using rounded() to get the grid point


